Reporting: reports, dashboards and goals
Last updated 26 September 2026
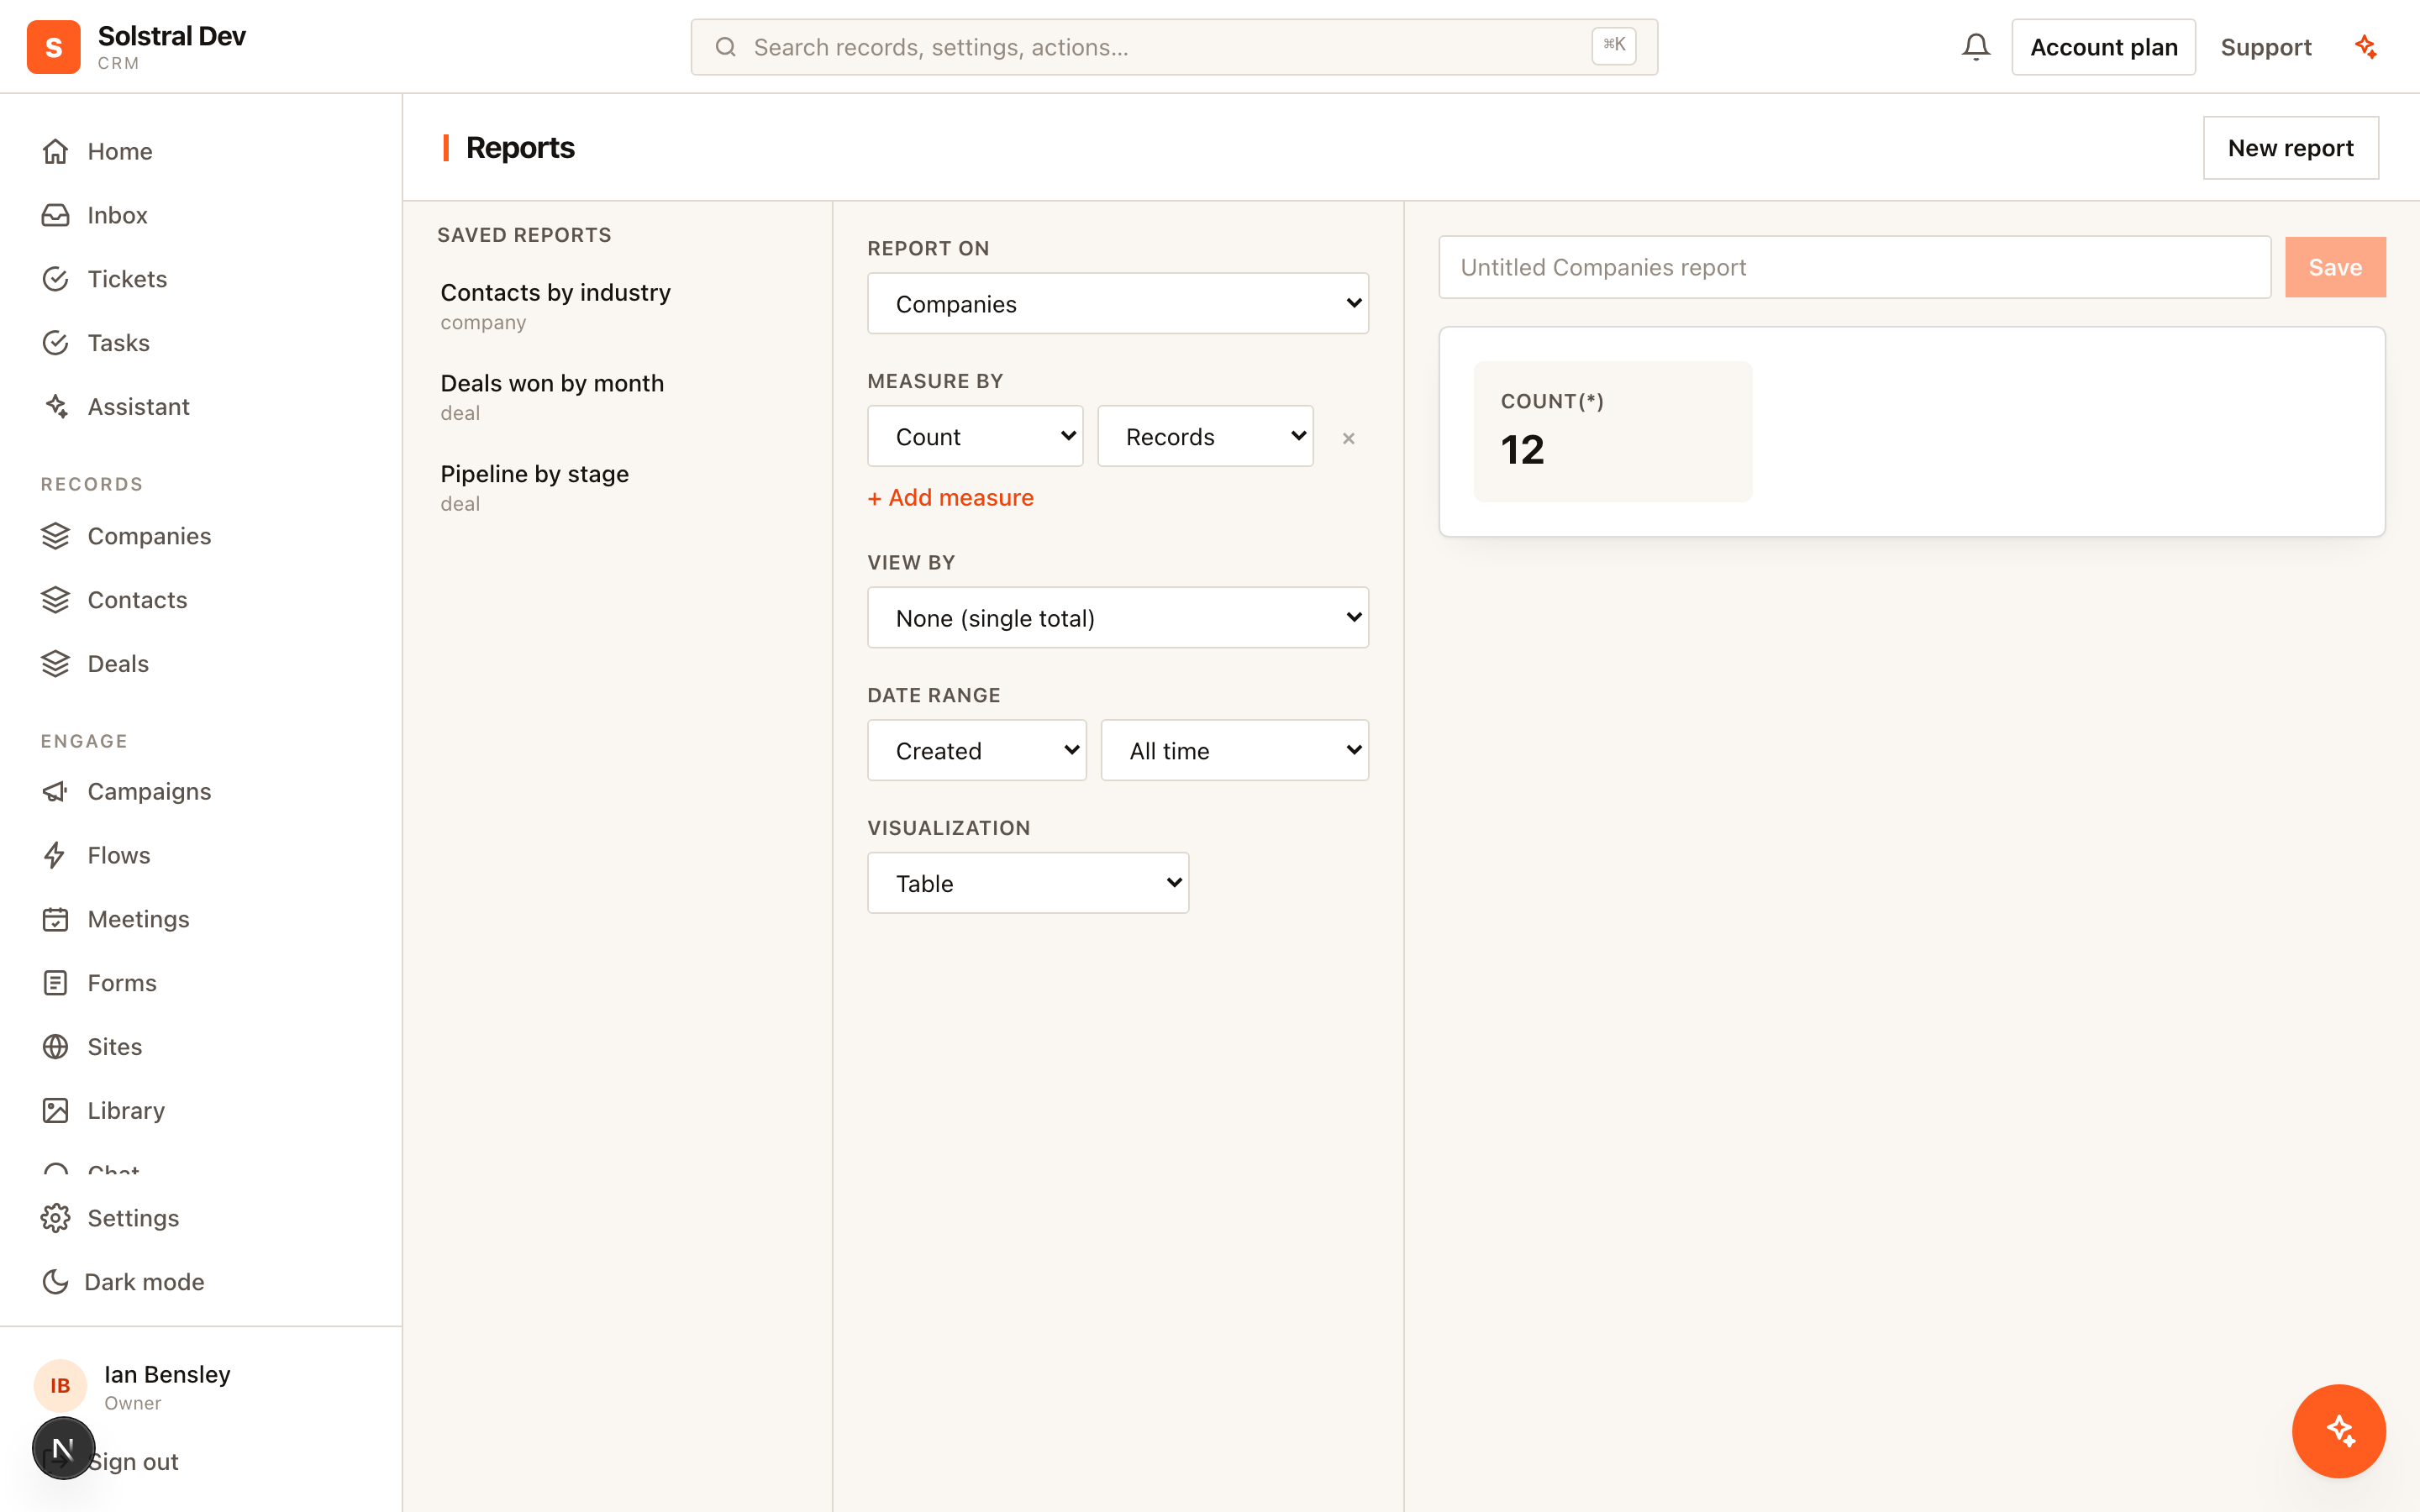
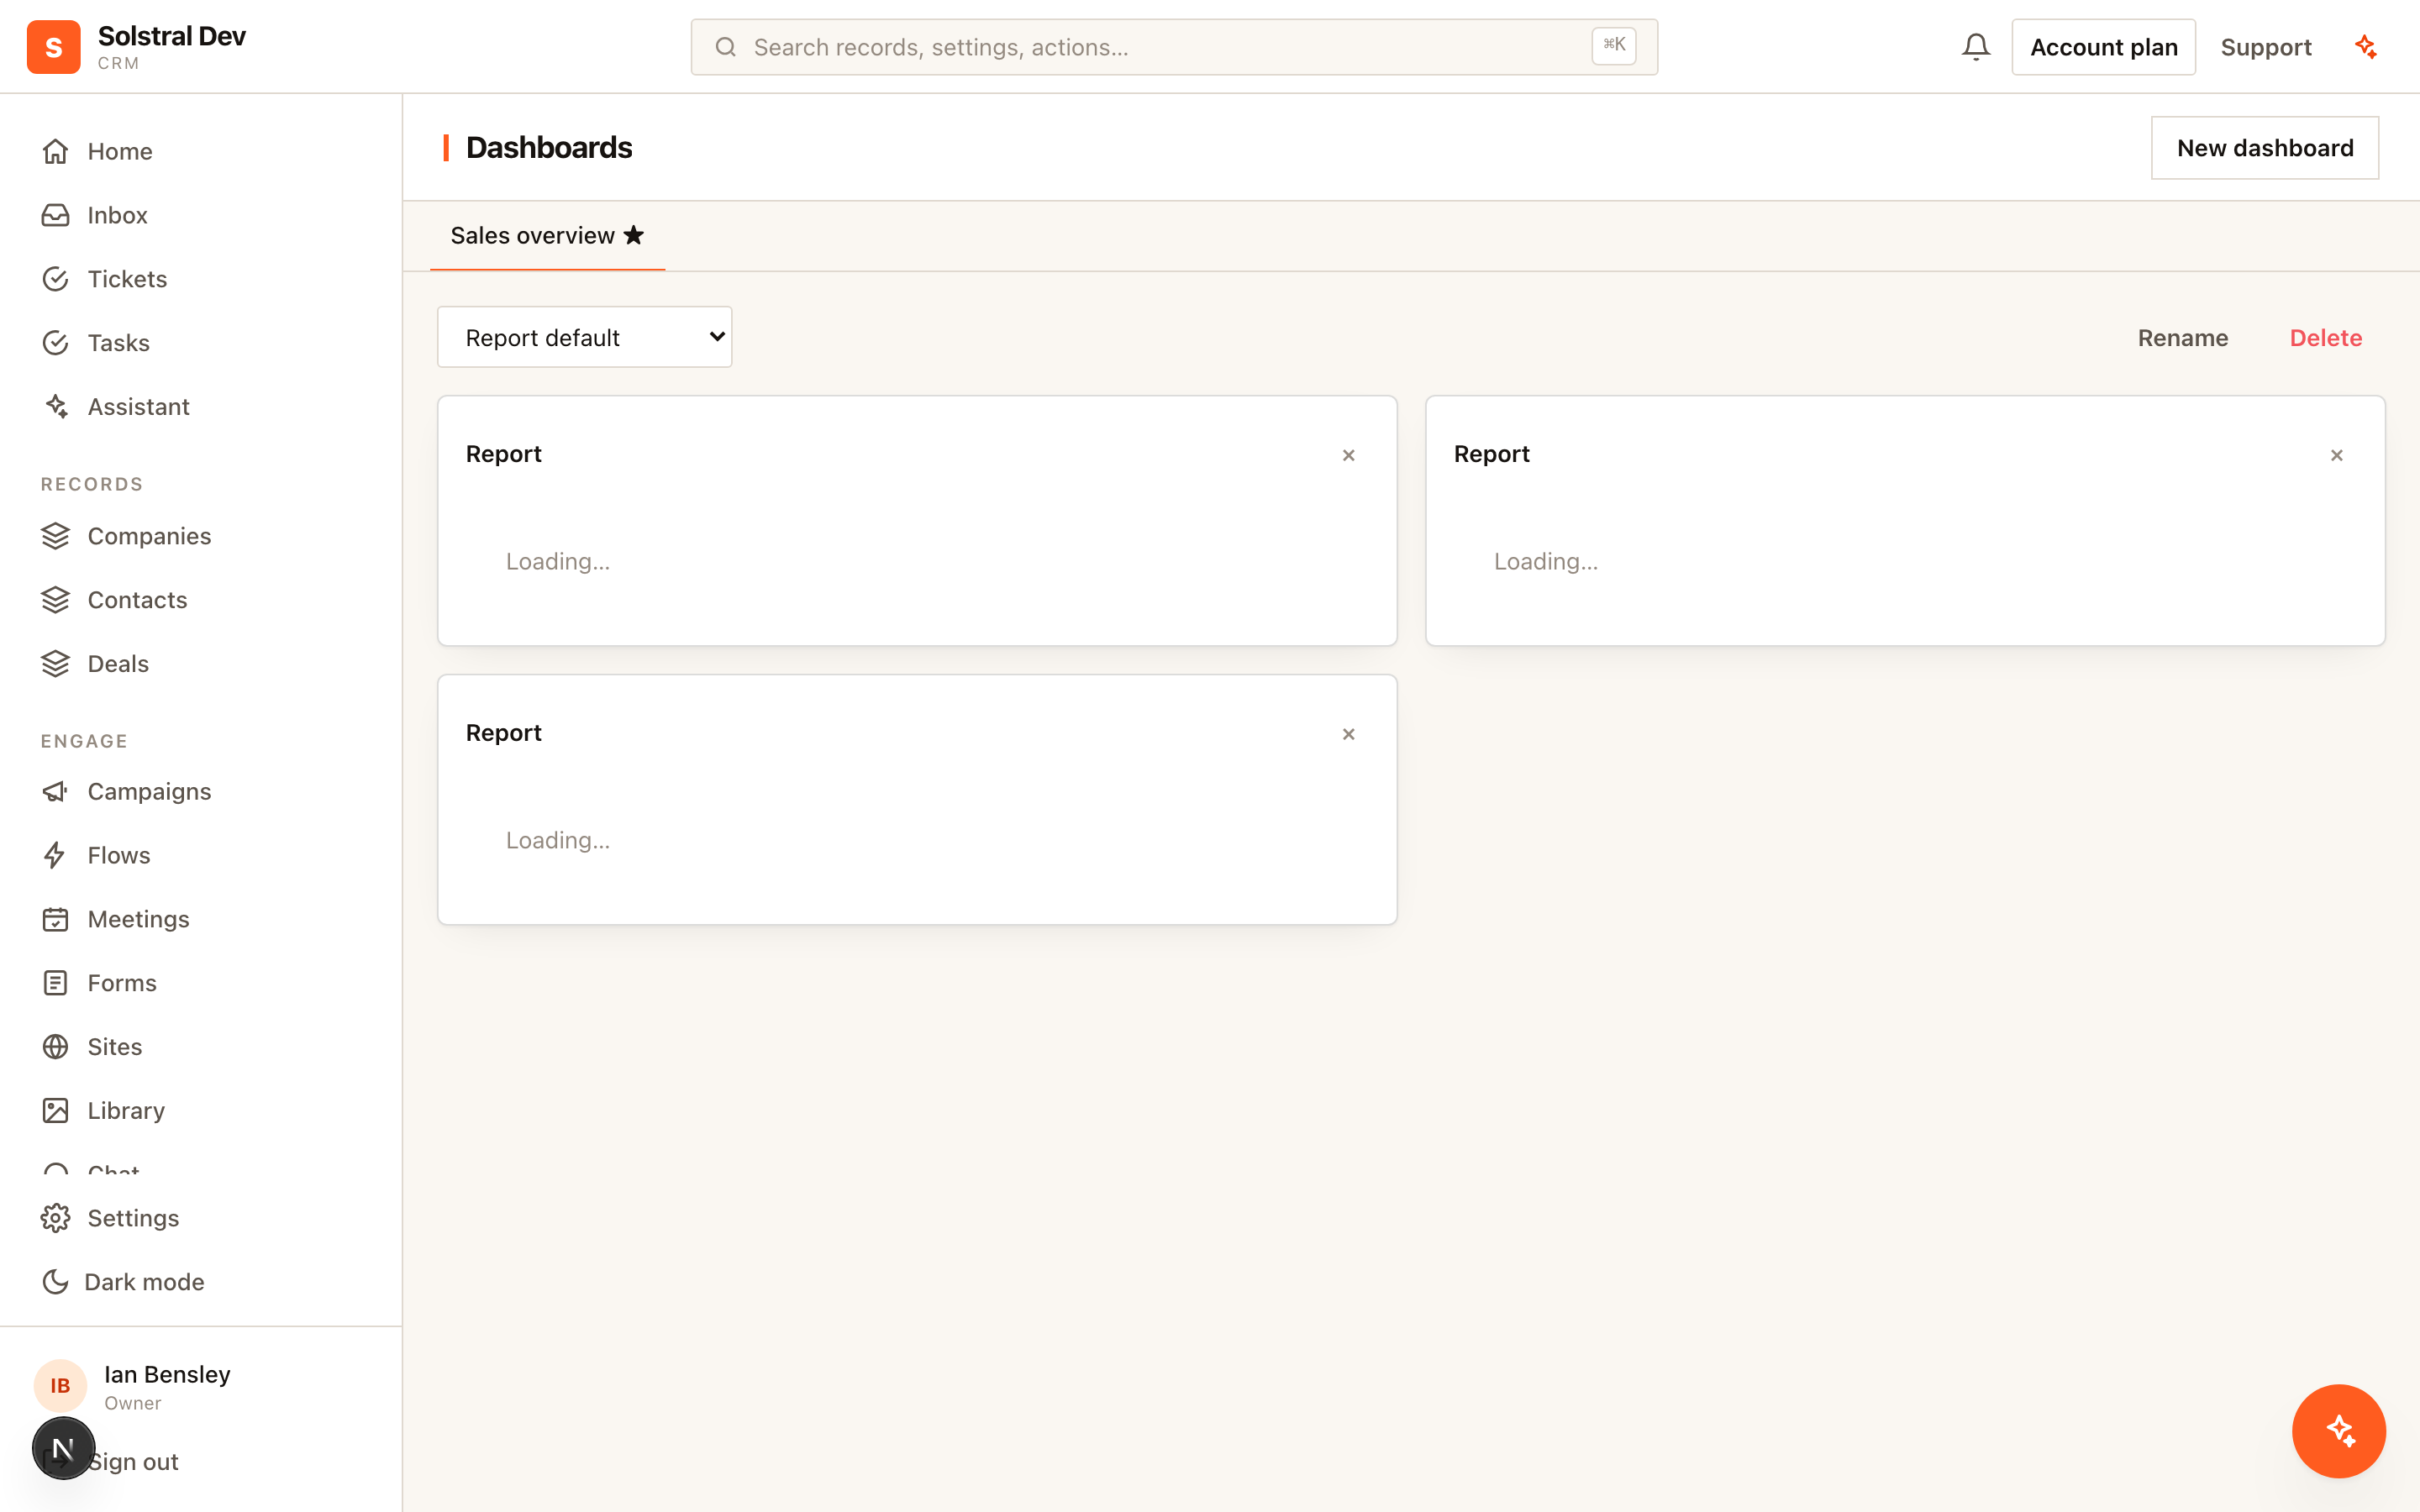
Reports, dashboards and goals are one module, Reporting, with a tab for each. It reads the same records you work in every day, including any custom objects and formula fields you have added, so there is no separate data model to configure and nothing to sync.
Turning it on or off
Reporting is a single switch. An admin can hide it for the workspace under Settings ▸ Platform ▸ Modules, or for a team under that team’s permissions. The switch covers all three tabs: nobody gets dashboards without reports, because every dashboard tile is a report.
1. Start from a question, or a template
Open Reporting and choose Create report. Templates cover the common questions — pipeline by stage, won value by owner, deals that have gone quiet — and open as an ordinary report you can change. Or start blank: “How much is in each pipeline stage?” gives you the source, the grouping and the measure in one sentence.
2. Configure, filter, style
The editor has three tabs. Configure picks the source, what to measure and how to group it — drag a field from the list on the left onto a slot, or pick it from the menu. Filters narrows it to the slice you mean, with a list of choices for dropdown fields. Style sets the chart, the number format, labels and stacking. The preview updates as you go, and dates follow your workspace time zone.
3. Compare and read it
Compare a period with the one before, like for like: this month so far against the same days last month, not against the whole of last month. The headline above the chart says what changed in words.
4. Click through to the records
Click a bar, slice or cell to see the records behind it in a side panel, or open the Records tab for the full list. You only ever see records you are allowed to see, so two people can open the same report and get different totals.
5. Put it on a dashboard
From a report, choose Add to dashboard. On the Dashboards tab, drag tiles to arrange them, resize them, and add goal cards and text notes alongside. Dashboard filters — date range, comparison, owner — apply to every tile, and a tile that can’t take a filter says so rather than quietly ignoring it. Save as default view keeps those filters for everyone.
6. Set goals
The Goals tab tracks a target for one person or the whole workspace, measured by the same engine as your reports. Each card shows pace as well as progress, so 60% on the 3rd reads differently from 60% on the 30th.
Who can edit what
Anyone can build their own reports and dashboards. You can edit what you created; admins can edit everything. Deleting a report removes its tiles from every dashboard, and the delete warning lists which ones first.
Reporting and web analytics
Reports cover what is happening in your CRM. Web analytics covers what is happening on your website, before someone becomes a record.
/dashboards and /goals still work: they open the matching tab in Reporting.