Feature reference — generated from the product
Reporting
Last updated 26 September 2026
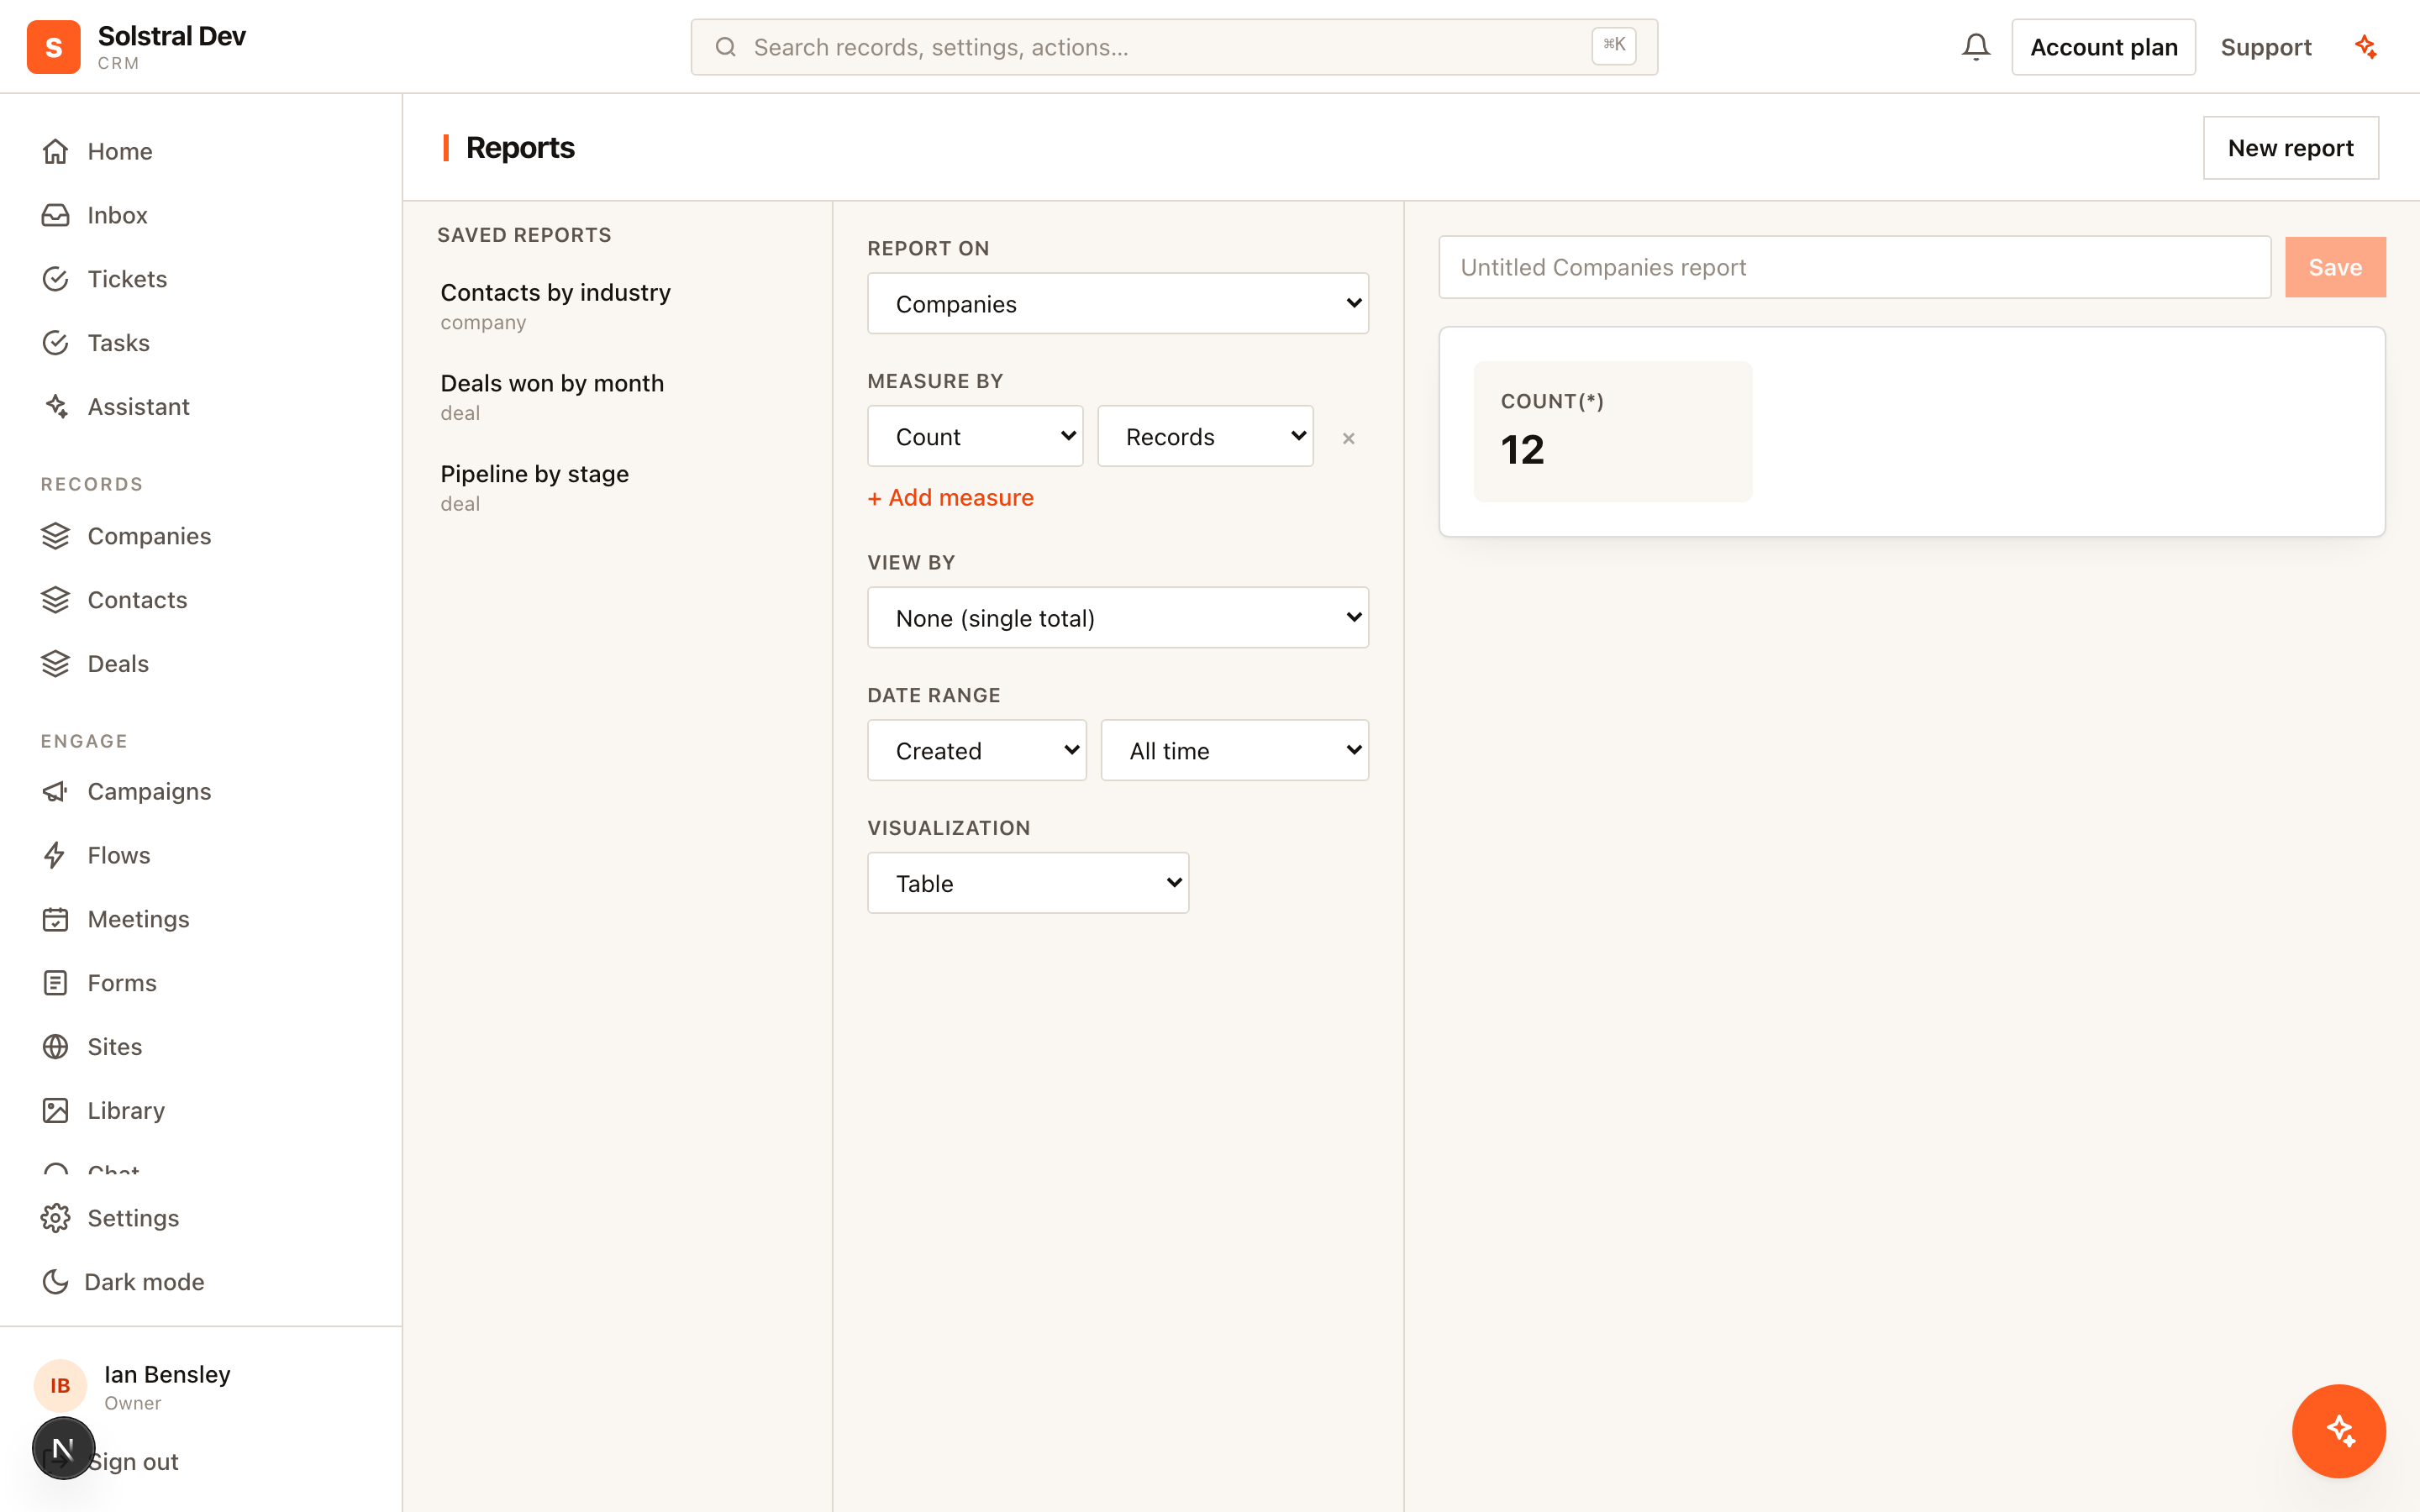
Reports, dashboards and goals in one module: build reports over any object and any field — including formulas — pin them to dashboards the whole team reads, and track targets against them.
What you get
- Every field is reportable — Standard, custom, computed — if it's on a record, you can chart it, group by it and filter on it.
- The whole product, not just records — Activities, email, campaigns, meetings, tickets, conversations, forms, automations and web traffic are all report sources — one builder, one set of dashboards.
- Pipeline analytics that need history — Stage-change history powers time-in-stage, deal duration, velocity and conversion funnels — for deals, tickets or any object with a pipeline.
- Dashboards for the room — Drag to arrange, resize to suit, and click any bar to open the records behind it.
- Targets and forecasts — Set goals by period and owner, and forecast weighted pipeline from your own stage probabilities.
Capabilities at a glance
- Report builder over any object and attribute
- Module sources: activities, email, campaigns, meetings, tickets, conversations, forms, automations, web events
- Stage history: time-in-stage, deal duration, velocity and funnels
- Compare any period against the previous one, with change indicators
- 13 visualisations incl. combo, scatter, heatmap, pivot and funnel
- Group by owner or team
- Click-through from any chart segment to the underlying records
- Goals and targets with progress tracking
- Weighted revenue forecast from stage probabilities
- Drag-and-drop dashboards with resizable widgets
- CSV export of results
- Charts in your brand colours, with a compare-to-previous headline in words
- One module switch for reports, dashboards and goals